Micro pockets of spectacular growth in latest capital city snapshot
Australian Bureau of Statistics (ABS) figures for the June quarter for capital city growth paint an interesting, if patchy, picture of property prices countrywide. Together with the latest Market Facts release from the Real Estate Institute of Australia (REIA), it certainly reinforces what we already know: that within any capital city market, there will be high performers and low performers sprinkled everywhere, irrespective of what the general market looks like.
While there’s no surprises in terms of which capital cities are weathering a major correction in house prices (Sydney and Melbourne), the latest ABS figures show that it’s the middle to upper segments of the property market that have seen the biggest falls in our two largest capitals. Melbourne, as we know from our last report, certainly still has swathes of affordable suburbs that continue to perform well, once you cast the net a little further out. And the REIA report indicates house prices in outer Sydney actually rose slightly for the quarter.
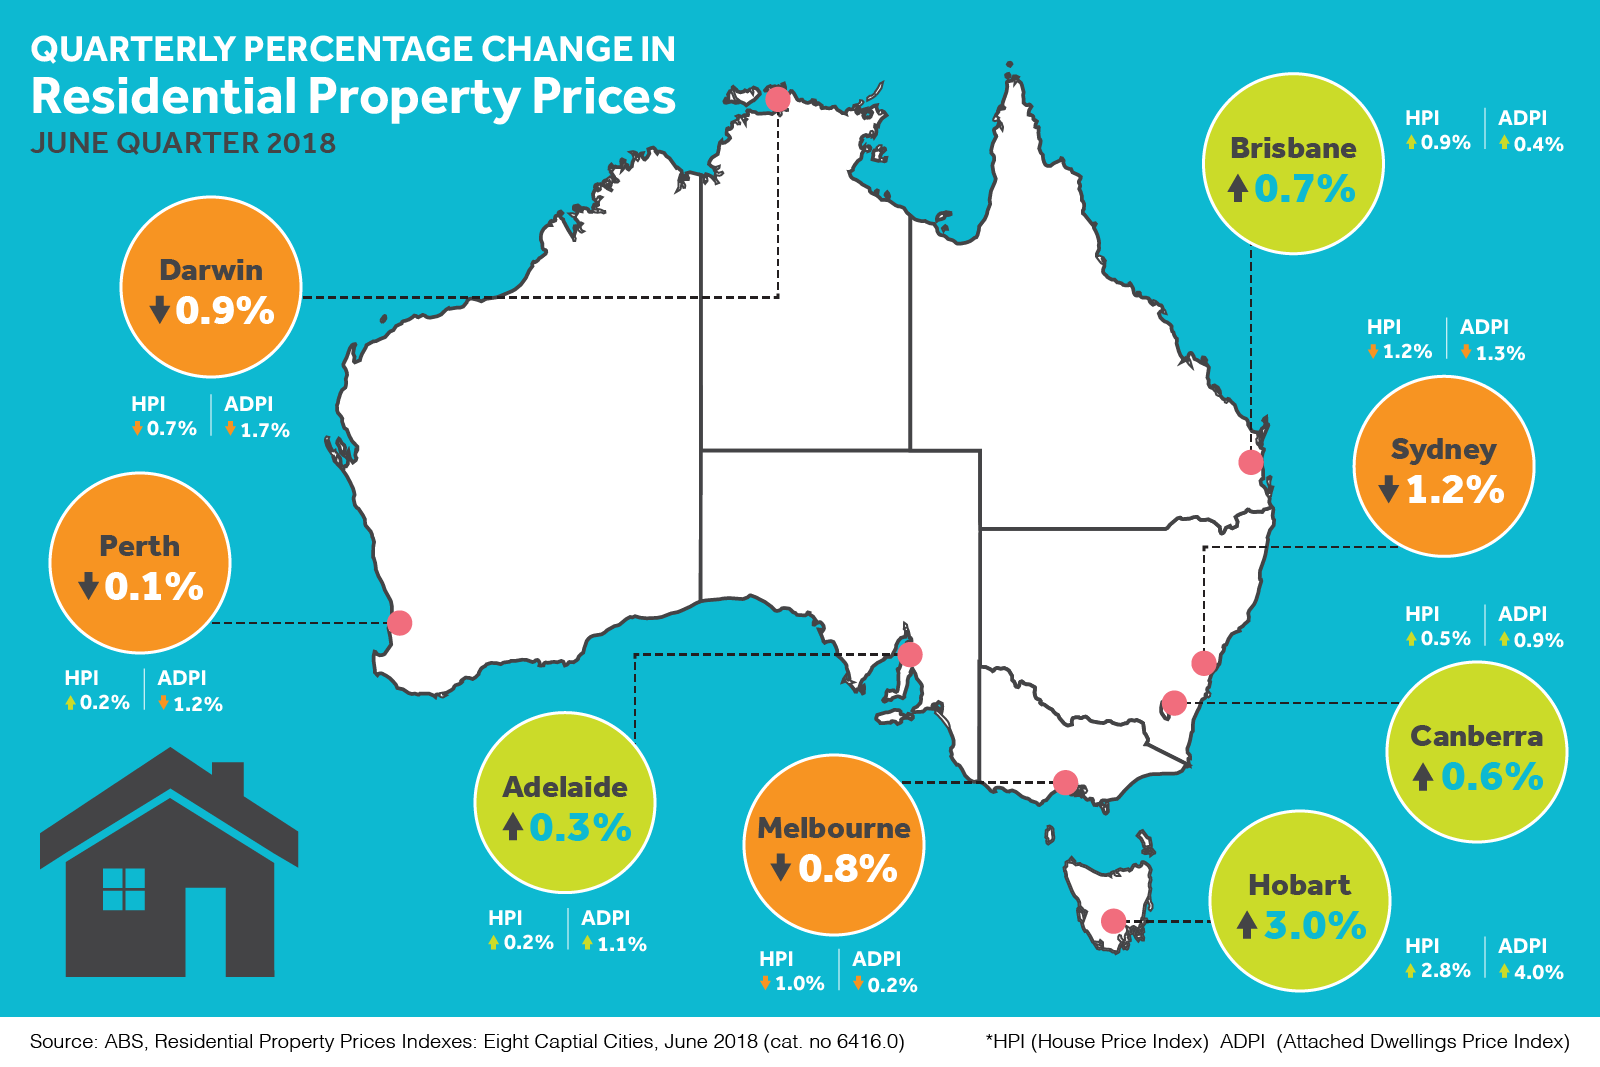
In other capitals, property prices were down in Perth and Darwin, but slightly up over the quarter in Canberra, Adelaide, Brisbane and particularly Hobart, which is up 15.5% for the year.
Here’s a snapshot of the current state of the capital cities, according to the June quarter ABS figures, released last week.
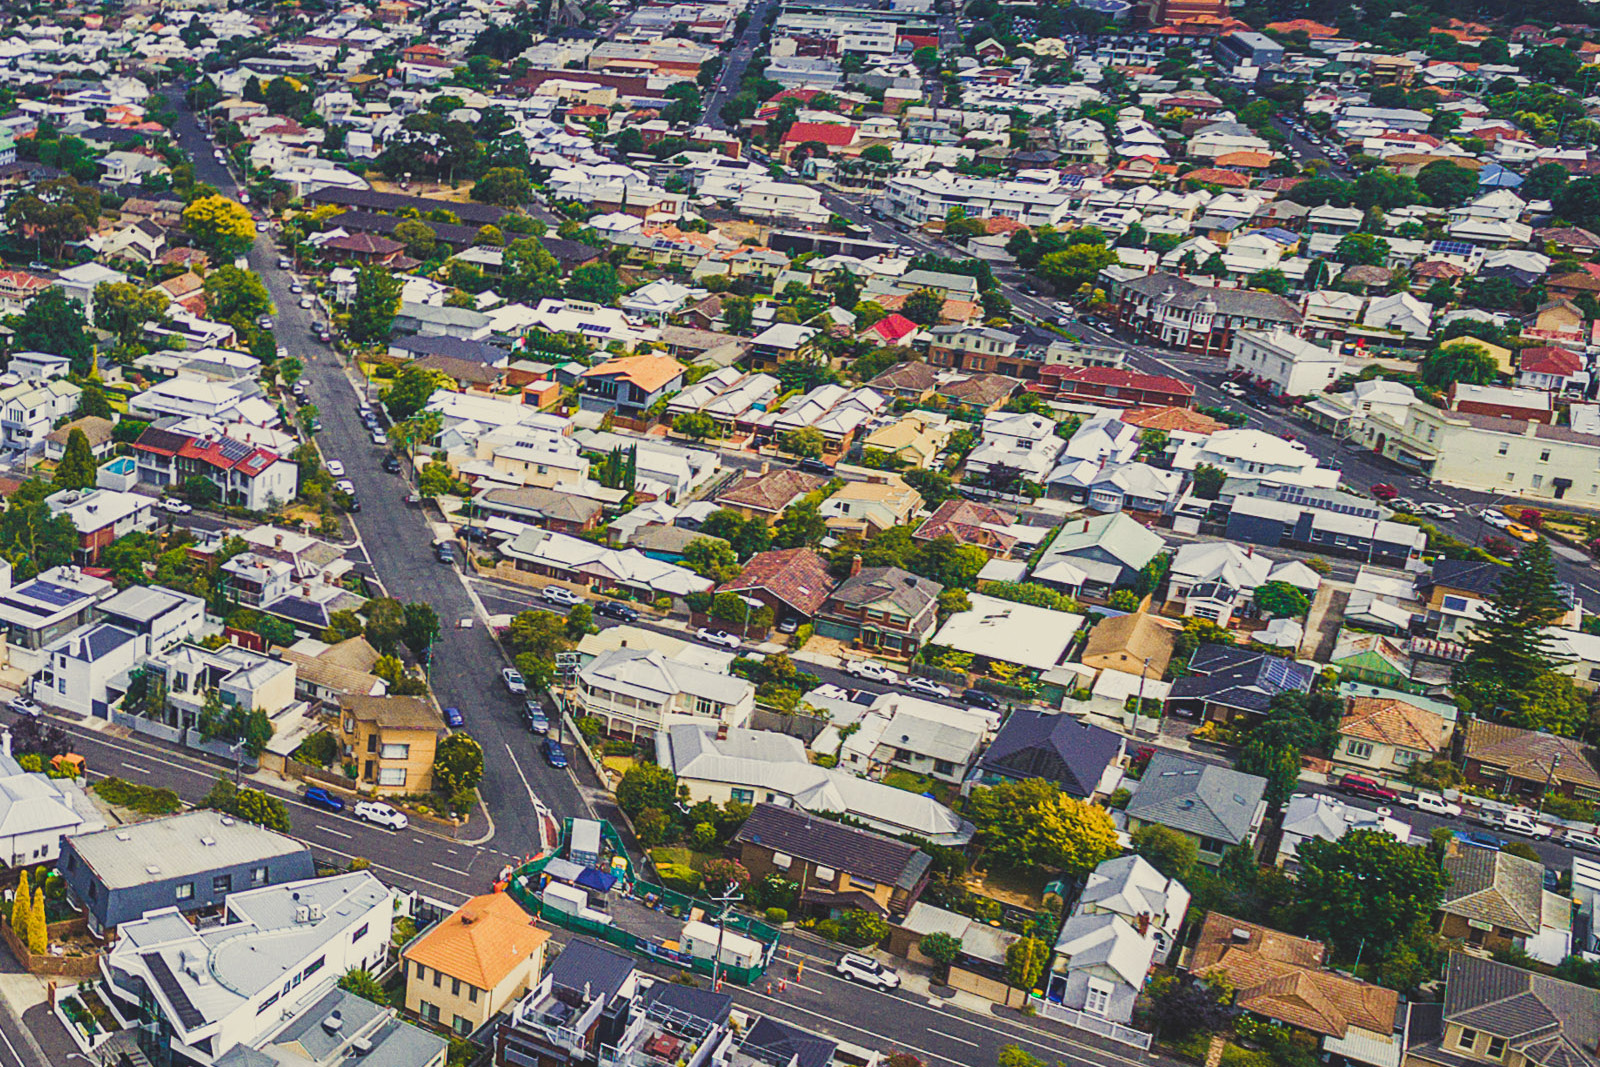
A tale of two cities: Sydney vs Melbourne
Sydney
Interestingly, the REIA’s wrap-up of property prices for the June quarter found that median house prices had actually increased 0.6% in outer Sydney (20+km from the CBD), but dropped 9% in the city’s inner ring and 3% in middle suburbs. Over the year to June, it recorded a house price fall of nearly 10% in inner Sydney, compared with roughly 3% in the outer fringes.
But then there’s this, a blog by guru John McGrath last week which shows a clutch of blue-ribbon inner suburbs in Sydney’s east which are still performing spectacularly and bucking the trend. Talk about micro markets! However, you’ll be hard pressed finding a bargain in Sydney, with the median house price still hovering around a heady $1.14m.
This compares to a median house price of $745,000 in Wollongong and $615,000 for Newcastle.
Melbourne
According to the REIA Market Facts report, median house prices in capital city Melbourne increased 0.5% over the quarter in outer Melbourne (and just over 6% for the year), but are falling across the city’s inner and middle ring. Things are still looking rosy for the regional Victorian boom centres of Geelong, Bendigo and Ballarat, which all continue to trend upwards.
In a separate release, Real Estate Institute of Victoria’s (REIV) latest Days on Market data shows that properties in Melbourne’s south-west are being snapped up faster than this time last year. Williams Landing, Seabrook, Point Cook and Altona were all highlighted as suburbs showing intense competition from buyers.
Other strong performers were Skye, Narre Warren South, Doreen, Cranbourne East and Cranbourne West, where properties lasted just 20 days on market.
Property prices are down in Melbourne, Sydney, Perth and Darwin, but slightly higher over the quarter in Adelaide, Brisbane and particularly Hobart, which is up 15.5% for the year.
Capitals on the up
ADELAIDE
Looking to the Real Estate Institute of South Australia for their June quarter stats, suburbs which have seen the largest growth over a 12 month period were Henley Beach South (up 52.69%), Smithfield (up 24.35%)and Henley Beach (up 23.46%). Other big movers included Athelstone, Norwood and Craigburn Farm. The June quarter statistics showed that growth in the South Australian median price was 1.19% up from the previous quarter, and 2.41% up from the same quarter last year.
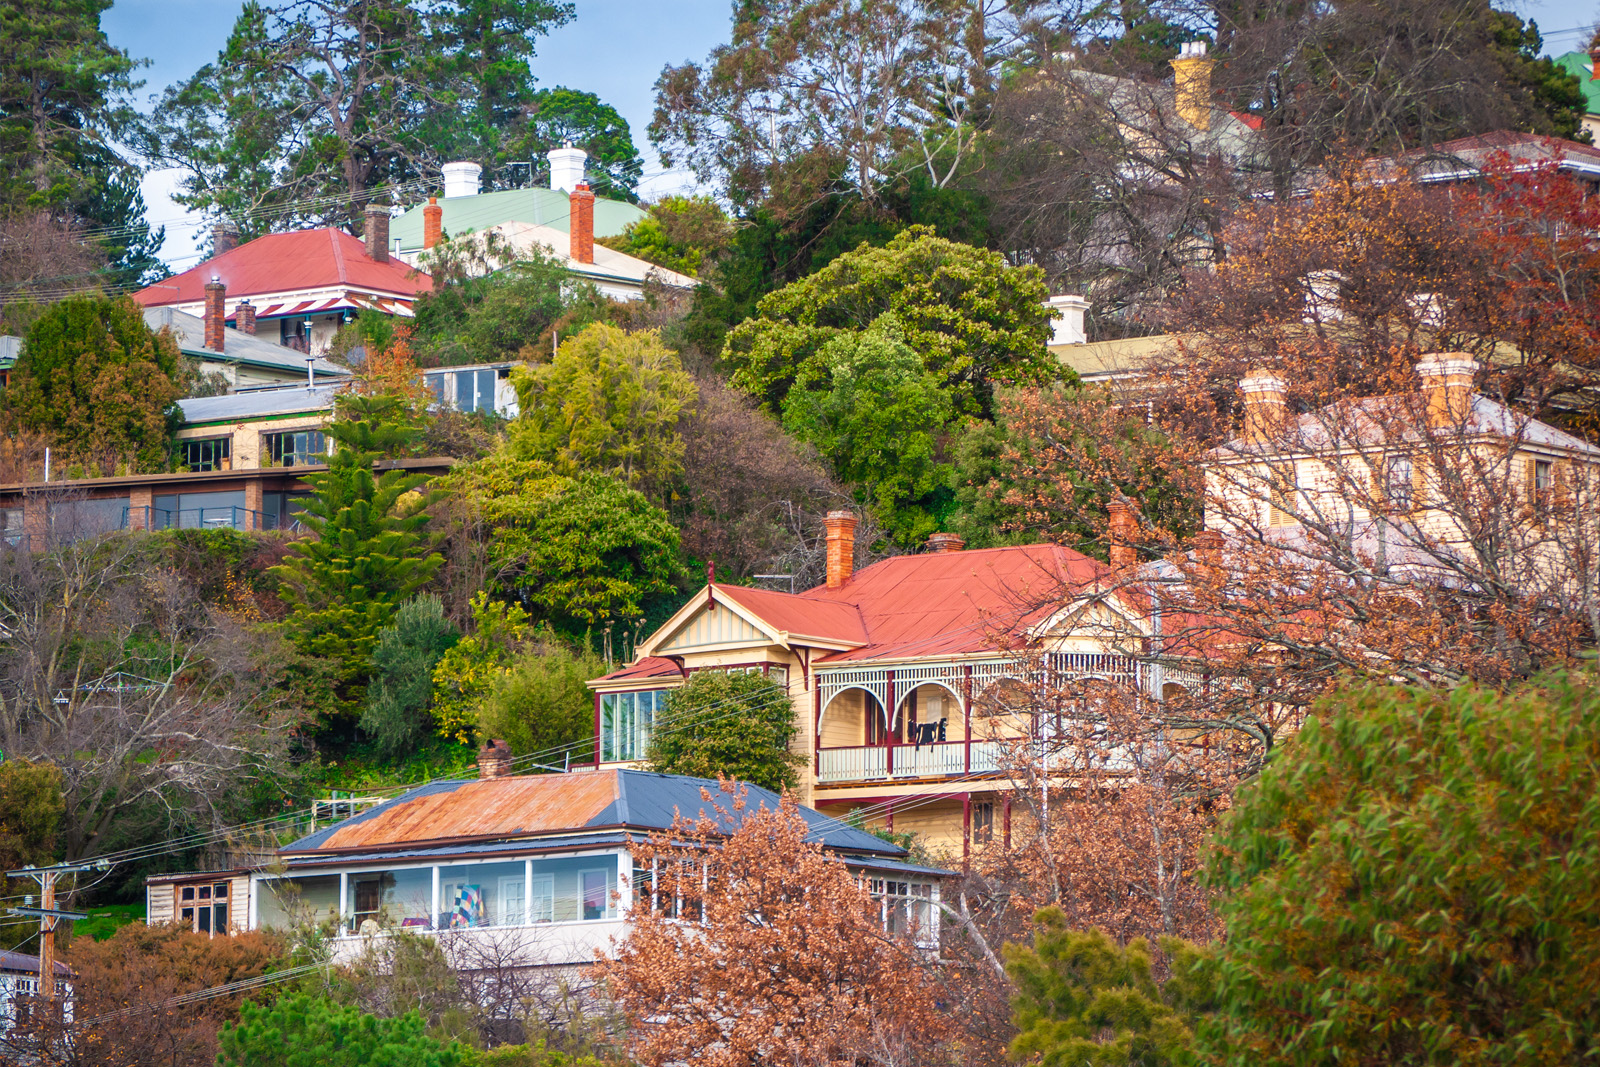
HOBART
According to the Real Estate Institute of Tasmania, the June quarter saw “some momentum coming out of the Hobart market”. It found the volume of house sales in Hobart retreating for the 2nd quarter in a row (down 0.9%). Nevertheless, it recorded Hobart median house prices up 17.7% for the year to June, with the median house price still a very affordable $506,000.
It seems buyer focus has shifted to Launceston, with the number of house sales up 8.1% over the quarter and a median price of $339,000. There was this interesting fact: “Interstate buyers acquired 479 properties over the quarter at a median price of $348,000. Over the half year, 1310 sales were made by Interstate buyers of which 732 were buying to reside here. The remaining 578 buyers were interstate investors who acquired property at a median price of $280,000. Interstate sales were dispersed evenly across all regions.”
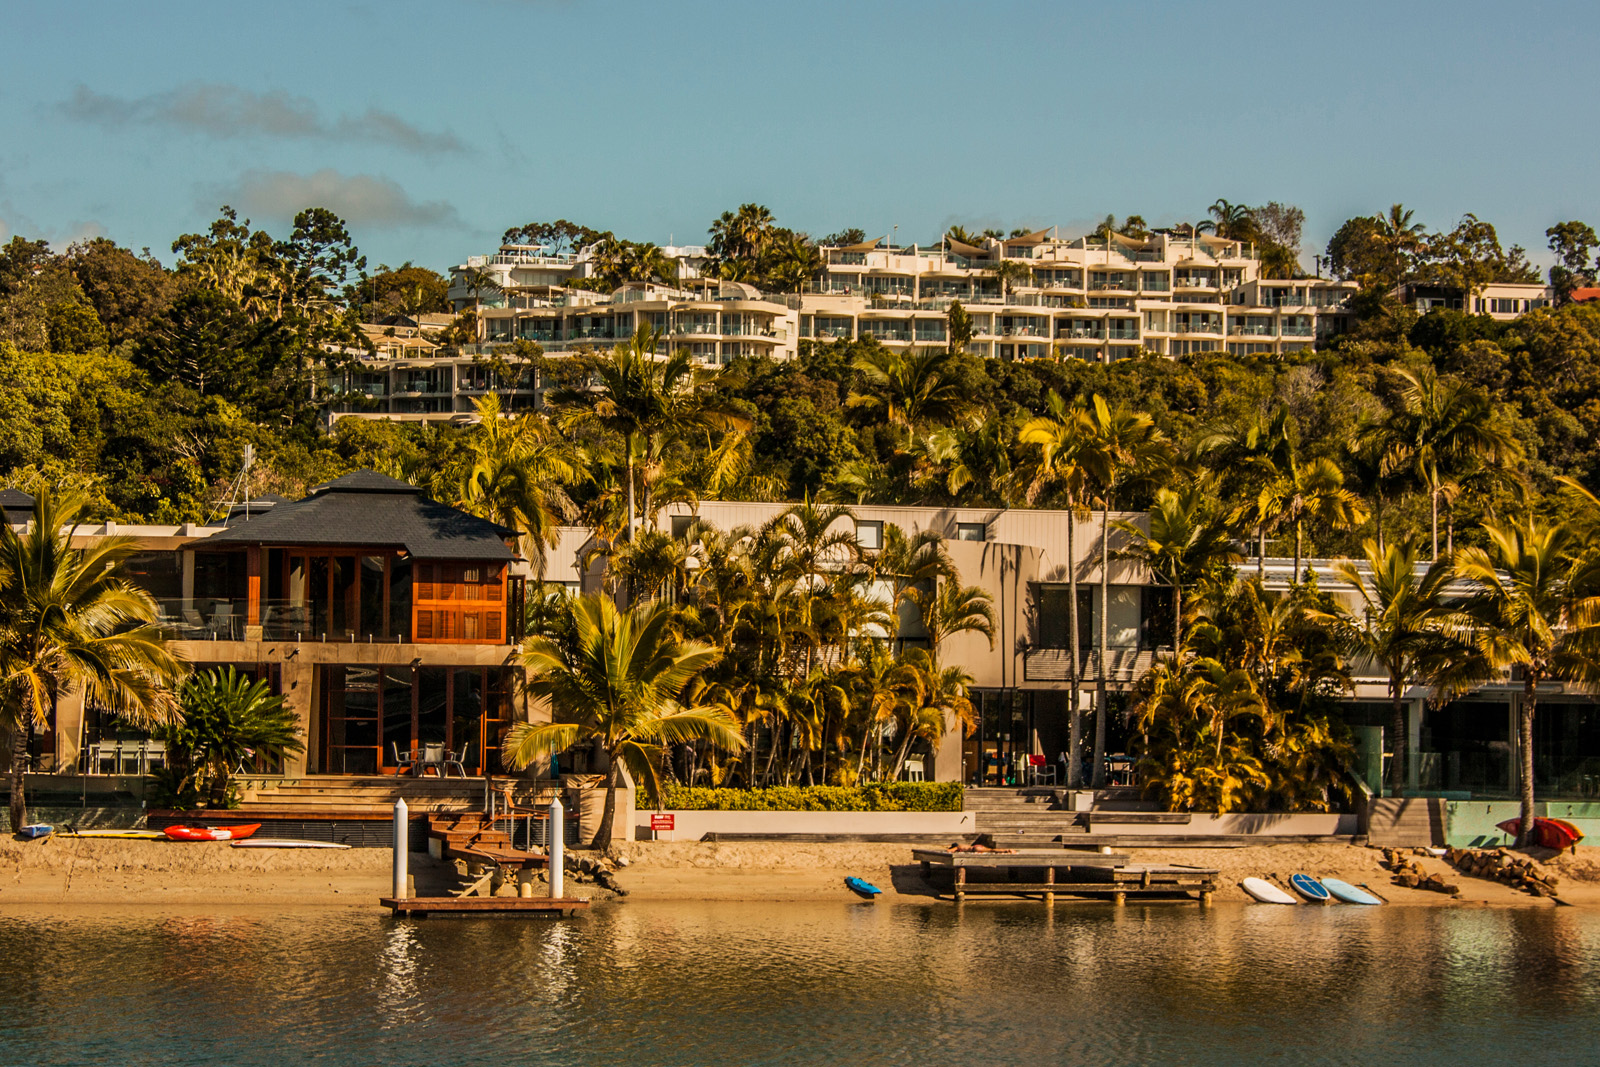
BRISBANE
While Brisbane property prices continue their steady incline, the Real Estate Institute of Queensland has just declared Noosa, on the Sunshine Coast, the strongest growth performer in the state, with the median house price growing 6.9% over the 12 months to June, and units growing 10.2 per cent.
The REIA, in its report, found median house prices increased in all Brisbane zones over the quarter. Over the past year, median house prices increased in middle and outer Brisbane, but fell in the inner city.
SUMMARY
So it’s clear to see all our capital cities are at very different stages of the property clock right now, which is part of the natural cycle every market will go through at some point. You can also see that those big picture stats don’t necessarily show what’s happening at a micro level. Within any boom market, there will be poor performing suburbs. And in a soft market, you’ll find high performers.
Remember, it’s important not to get hooked on when to buy. Trying to judge the perfect time takes your focus away from all the due diligence steps and detailed research you need to do to uncover the real gems.
ABS figures in detail
Sydney
- For established houses, a fall of 1.2% was driven by the middle to upper market ($1.3m-$2.4m). Annually, house prices fell 4.1%.
- For attached dwellings*, falls continue to be seen across most segments of the market, with weakness most evident in the middle to upper segments ($970,000-$1.39m). Annually, attached dwellings fell 3.4%.
Melbourne
- House prices fell 1%, predominately driven by the middle to upper market ($1.17m-$1.67m). Annually, house prices rose 2.6%.
- For attached dwellings, the 0.2% fall was primarily driven by the middle to upper market ($590,000-$810,000). Annually, prices rose 1.4%.
Perth
- House prices rose 0.2%; attached dwellings fell 1.2%. Annually, house prices fell 0.4%, and attached dwellings fell 2.9%.
Darwin
- House prices fell 0.7% and attached dwellings fell 1.7%. Both were also down over the year to June.
Brisbane
- House prices rose 0.9% and attached dwellings rose 0.4%. Annually, house prices rose 2.1% and attached dwellings fell 0.2%.
Hobart
- House prices rose 2.8%, and attached dwellings rose 4%. Annually, house prices rose 15.5% and attached dwellings rose 15.1%.
Adelaide
- House prices rose 0.2% and attached dwellings rose 1.1%. Annually, house prices rose 2.4% and attached dwellings rose 1.2%.
Canberra
- House prices rose 0.5% and attached dwellings 0.9%. Annually, house prices rose 3.8% and attached dwellings 0.5%.
* The term ‘attached dwellings’ includes flats, units and apartments plus semi-detached, row and terrace houses.